This week I was surprised to figure out that elevation logs that indicate a Global Admin becoming a User Access Administrator don’t flow to Log Analytics. It’s not possible to enable diagnostics settings for it.
TL;DR I built a Logic App that forwards those logs to Log Analytics so I can have Analytic rules in Sentinel report if this action happens.
Background
An Azure AD Global Admin at the company I work at, notified me that he was going to become a User Access Administrator, following the procedure described here. Global Admins in Azure AD might (or should) not have access to all subscriptions and management groups and that’s exactly the power they grant themselves if they become a User Access Admin.
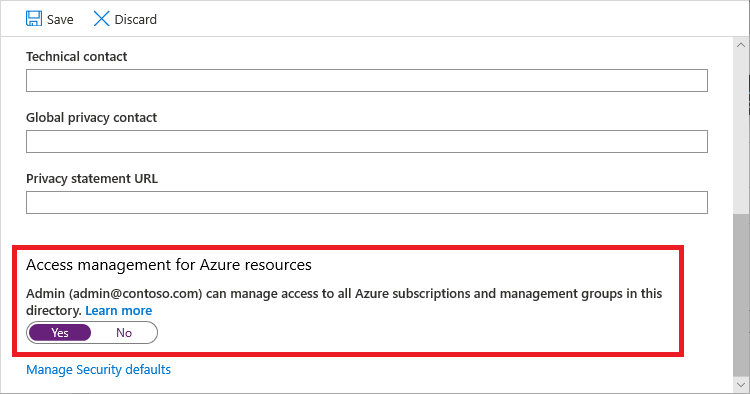
It’s actually trivial to do as a Global Admin. You go to Active Directory in the Azure Portal, go to Properties, scroll down and flip the switch to “Yes”. Congrats, you can now manage any subscription and management group.
Having trust in the Analytics rules my colleagues and I have created and that knowing we have Azure AD AuditLogs and ActivityLogs, I told him we should see his activities pop up in our Sentinel environment.
When that didn’t happen, I decided to do a small investigation for these logs since they’re actually important and I want to know about elevations to User Access Admin. But to my surprise I couldn’t find any logs in Sentinel that indicated that particular user becoming a User Access Administrator.
Now, I’m not gonna lie, I spent a few hours on “reading” the above documentation and checking, and querying, and more checking in my own Dev tenant at home, etc. And even when I became User Access Admin in my own tenant, I wouldn’t get any logs for this activity… (nothing, nada, noppes)
The answer
A thorough read of the documentation revealed the answer:
Elevate access log entries do not appear in the standard activity logs, but instead appear in the directory activity logs.
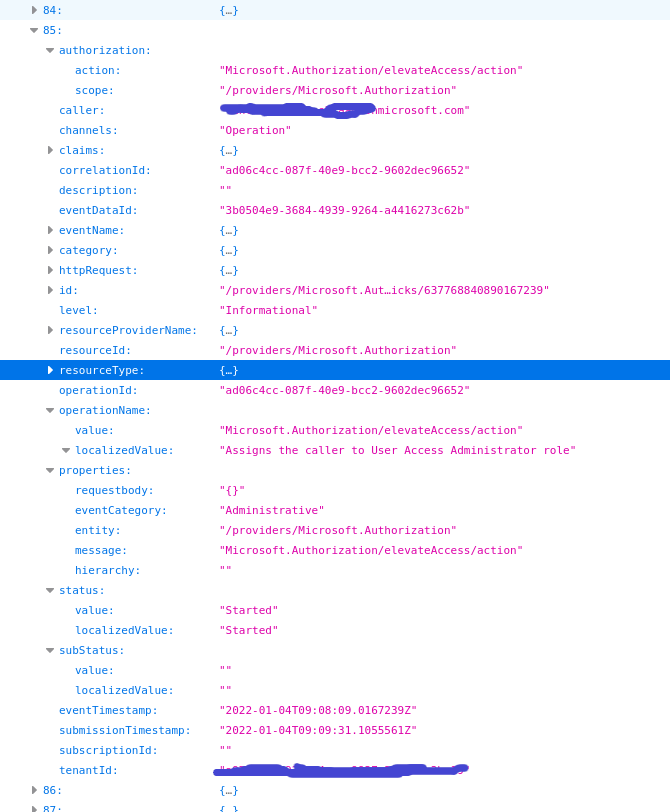
The hell is this? Well turns out that there’s something called “Directory Activity Logs” besides the normal Azure AD Activity logs. You find it (as the documentation mentions) under the Monitor service > Activity Logs > Directory Activity logs. And lo and behold, I saw the statement I wanted to see.
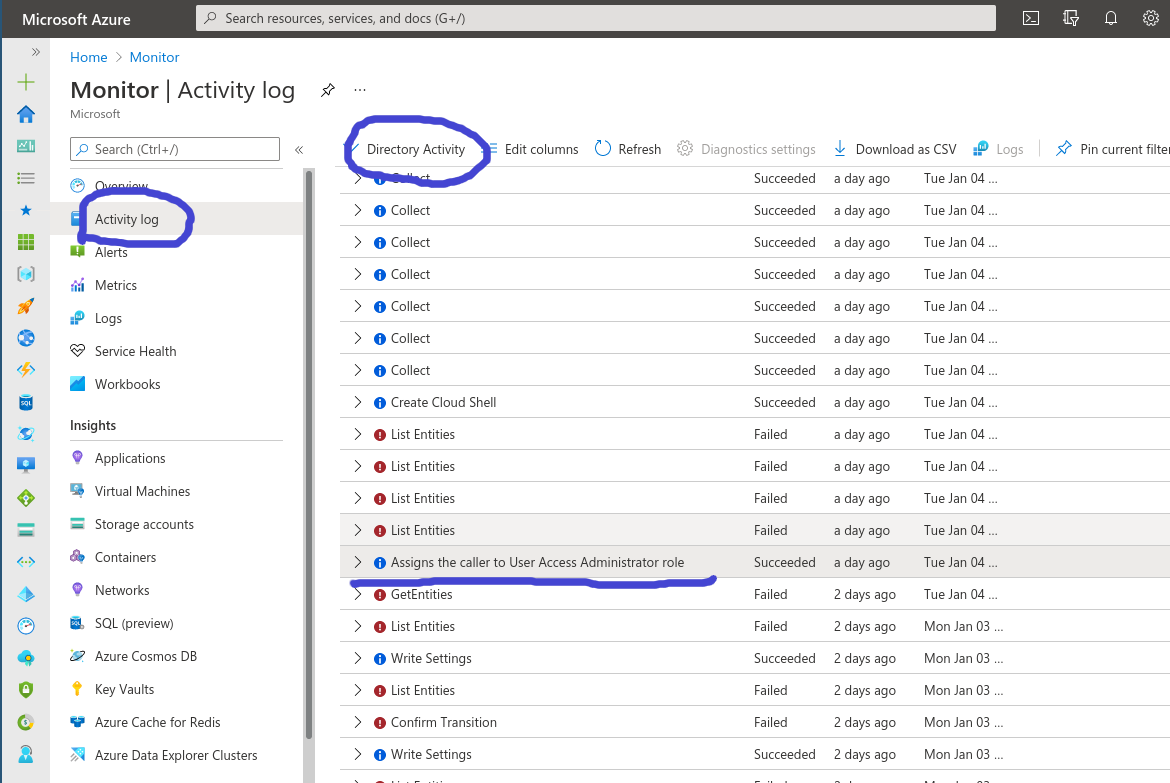
There's the sneaky bastard
Ok, we have the log in the Azure Portal. Why isn’t it in my Log Analytics Workspace? Well as you can see above, you cannot click on “Diagnostics settings”. As such, you cannot get them in Log Analytics the usual way…
Ok, back to the docs. There must be a way.
Turns out the Microsoft way is either having a regular look at these logs as a Global Admin in the Portal (yeah, not gonna happen) or to be part of a group with rights to read those logs and periodically run some PowerShell commands. Yeah, that’s also not gonna happen…
Luckily if we take a close look to what the PowerShell commands do, it’s just a HTTP Rest call. We can do this automated with a Logic App!
Writing Logic Apps for things that should be included in Sentinel has become my pet peeve so I rolled up my sleeves and in 5 15 minutes had a working flow towards Log Analytics.
Automating with Logic Apps
After creating a Logic App, you need to enable a Managed Identity for the Logic App. Then open your Cloud Shell and give it the rights to read the Directory Activity Logs:
az role assignment create --assignee "<your logic app MI>" --role "Reader" --scope "/providers/Microsoft.Insights"
Then give this Managed Identity Log Analytics Contributor rights on your Sentinel environment so we can send logs to it. (Go to Sentinel > Access control > Add role assignment) You end up with this:
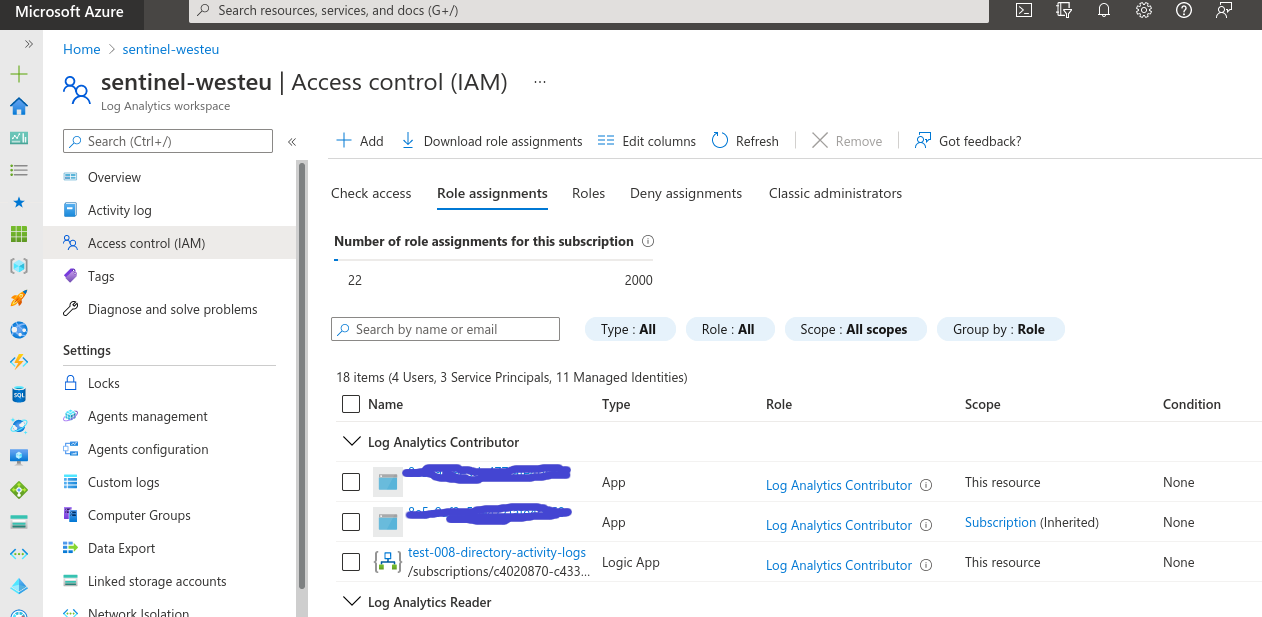
As we want, our logic App MI is a Log Contributor in the Sentinel workspace.
Let’s start with the Logic App Designer. The first two blocks are easy, we have a recurrence (every 5 minutes for example) and a variable that contains the date from which we want to retrieve directory activity logs:
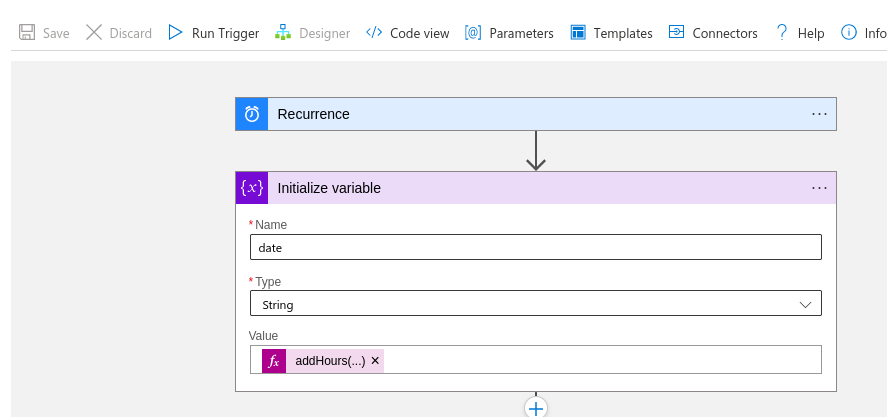
Since this is a test, I just added -12 hours to the current time so we look back a bit but adjust this based on your recurrence:
addHours(utcNow(), -12)
Then we take the PowerShell command az rest from the docs and format it for the Logic App to use inside a generic HTTP connector:
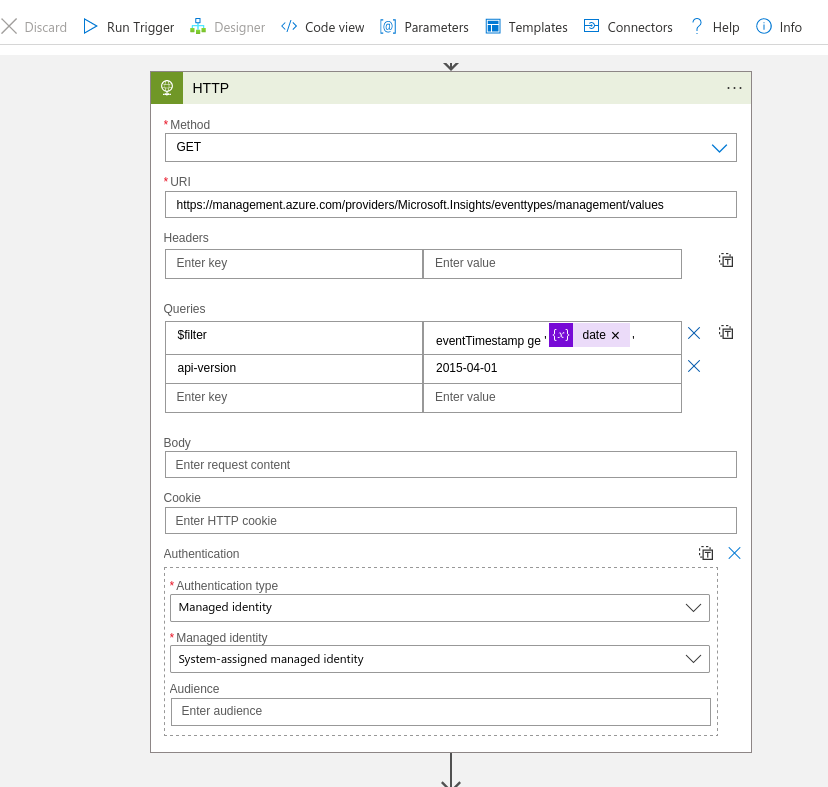
If you run this, you get a JSON formatted like this:
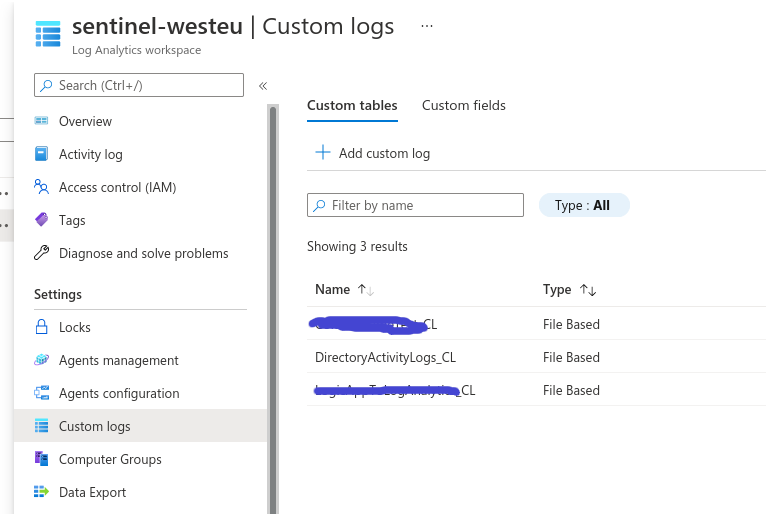
Intermezzo: creating a Custom Log in Sentinel
We now have to create a Custom Log in the Log Analytics workspace. I called mine “DirectoryActivityLogs_CL”. Note that the CSV you upload as sample data can just be one column, one row, it honestly doesn’t matter….
Sending the data from a Logic App to Sentinel
For every entry in the HTTP response, we want to send the event to Log analytics. I chose to add an additional Condition to only forward the elevateAccess logs but you’re free to send everything…
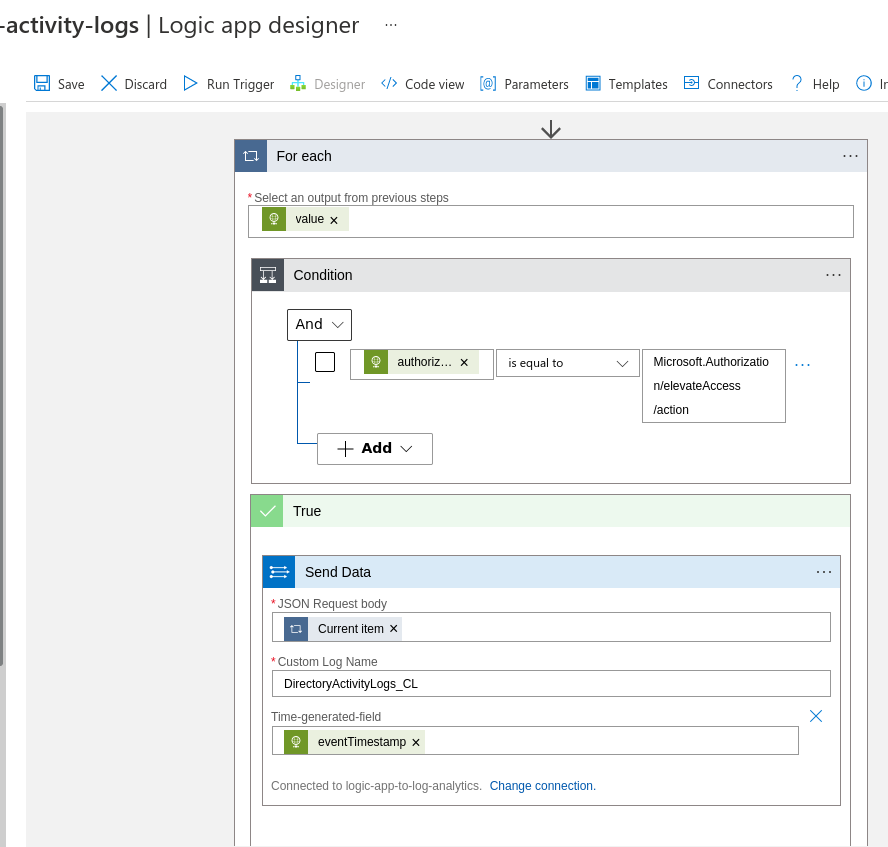
Be lazy and just send the entire JSON blob to Sentinel
If you didn’t make a connection yet, go and do that. You find the workspace keys in the Log Analytics blade under “Agent Management”. It’s the same key as the Windows and Linux agents use to connect to Log Analytics:
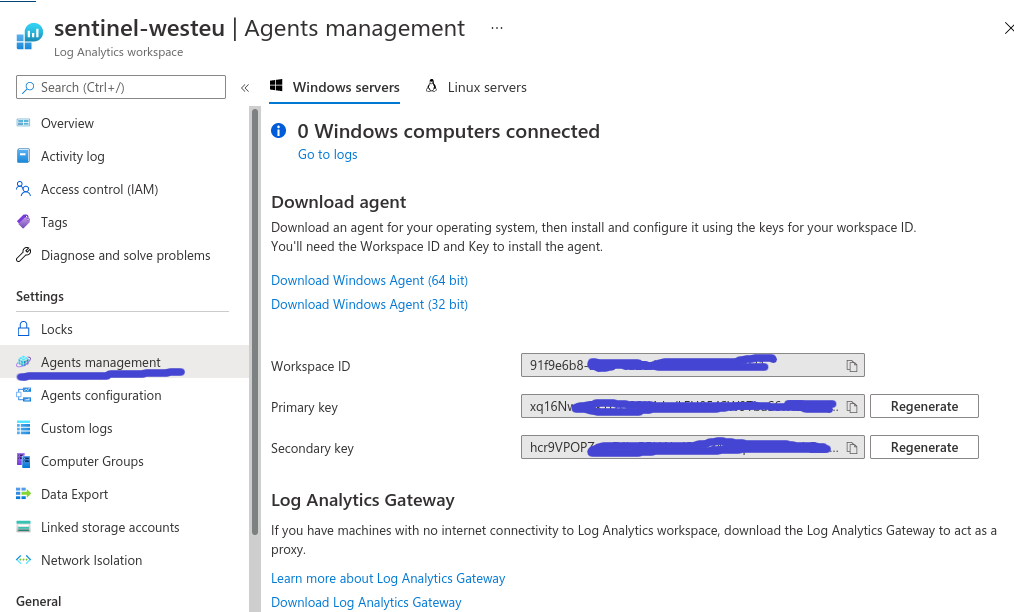
Redacted for obvious reasons
Results
Now run that Logic App and then grab a coffee since it takes a few minutes for the log to show up in the table.
Back from your coffee? Let’s take a look:
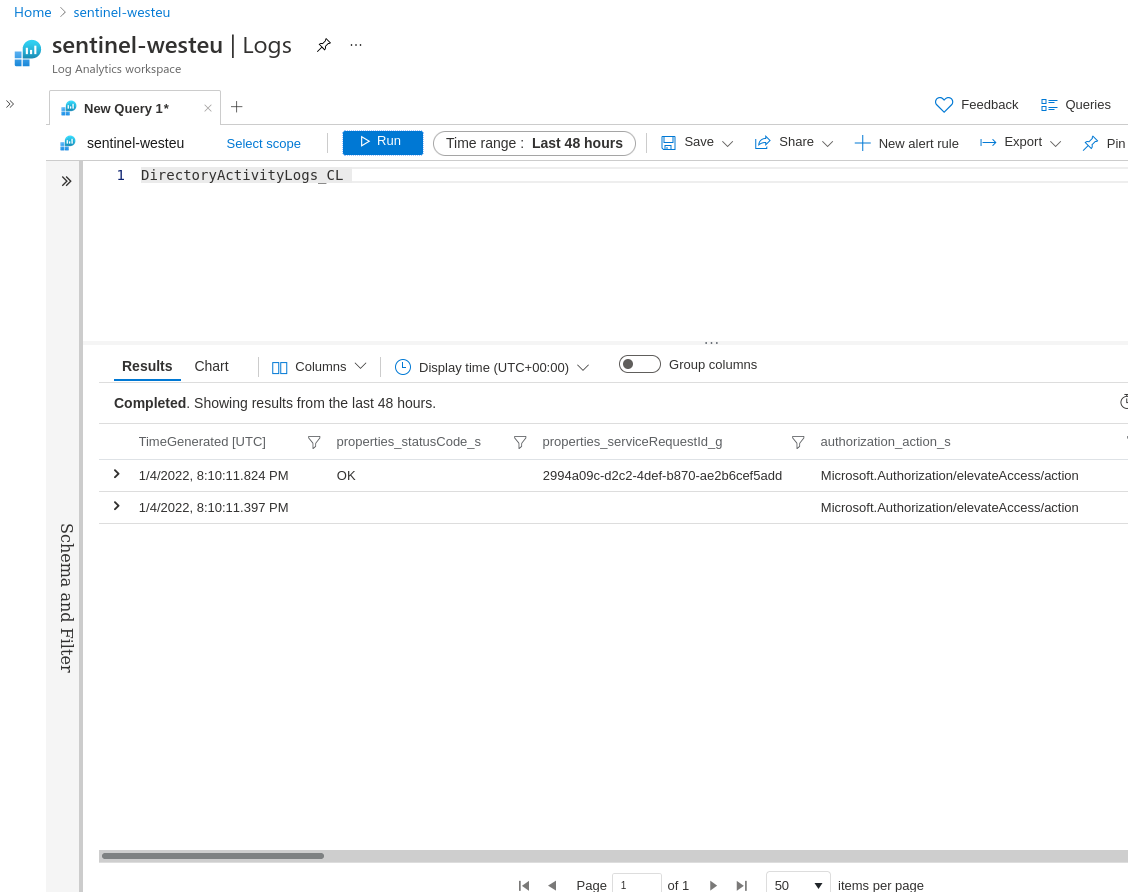
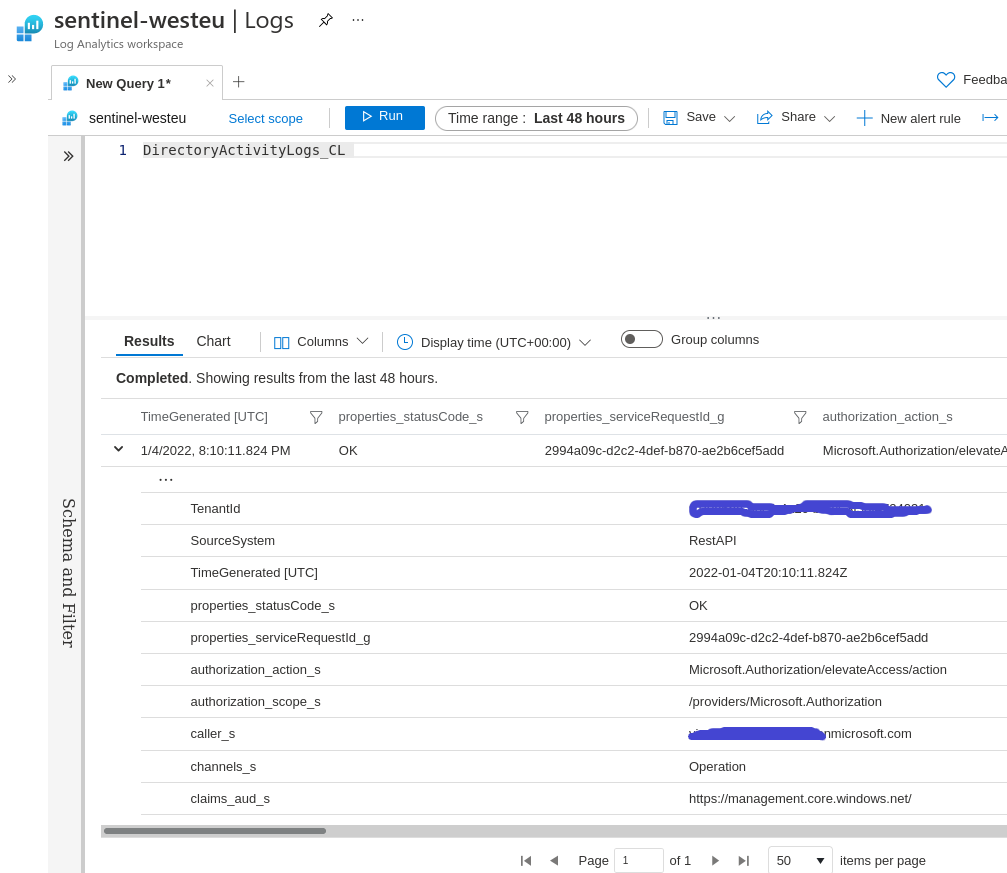
We got the data in Sentinel
Comparing it with our raw JSON above, it seems that it was flattened and all column names have their data type appended. Not exactly what we want but making it nicer is left as an exercise for the reader (such as fixing the timestamps 🙂 Although I honestly don’t know how to get rid of those suffixes)
Conclusion
Not too happy this isn’t out-of-the-box in Azure but luckily we have the tools to set it up ourselves.